
4 Charts: The Wealthy Pay Lower Tax Rates
Federal tax owed by 8 families

Most Americans have already filed their taxes.
They’re due tomorrow — April 15.
Today’s article is brief — 4 charts showing the Federal tax owed by 8 families.
The only differences are how much they earn — and how they earn it.
Each family is married with two young children and takes the standard deduction.
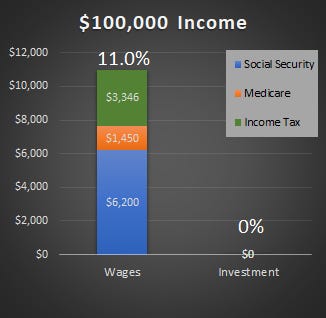
The first two families each earn $100,000 — one from wages, the other from long-term investment income.
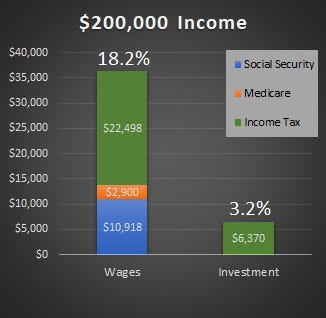
The next two families each earn $200,000.
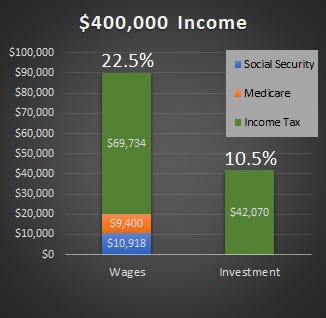
The next two families each earn $400,000.
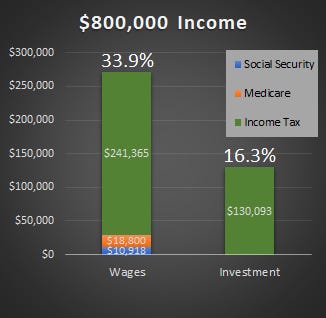
The next two families each earn $800,000.
Observations
Long-term investment income can be taxed as low as 0% (up to $96,700 in 2025 for married couples).
The amount you pay in taxes depends not just on how much you make — but how you make it.
Wage income is subject to Social Security and Medicare taxes. Investment income is not.
Many discussions about “taxing the wealthy” focus on wage tax brackets. But higher-wealth households often earn a significant portion of their income from investments.
As a result, very wealthy households can have lower effective tax rates than middle-income households earning wages.
This is one of the reasons the wealth gap has widened over time.